How To Use Appdome's Mobile Risk Index™ (MRI)
Mobile Risk Index™ (MRI) Overview
The Mobile Risk Index™ (MRI) is an AI-driven metric that evaluates the overall risk level facing a mobile brand by analyzing live threat data, defense posture, and industry-wide trends. Built on Appdome’s autonomous SecOps intelligence, MRI provides a dynamic, numerical representation of risk, continuously updated using trillions of monthly threat events and your app’s real-world attack surface. It highlights where threats, vulnerabilities, or defense gaps are increasing exposure.
MRI helps mobile teams:
- Measure the app’s risk level using a clear, data-backed score.
- Compare performance and exposure against global and industry benchmarks.
- Analyze indicators such as infection rate, frequency, and attack velocity to identify emerging threats.
- Use real-time insights and trend analysis to prioritize defenses and strengthen security posture.
- This provides a fast, objective way to understand risk, reduce investigation time, and guide data-driven security decisions across the mobile business.
Prerequisites for Using Appdome’s Mobile Risk Index™:
- Before using Mobile Risk Index™, ensure you meet the following requirements:
- Appdome account (create a free Appdome account here)
- A license for Agentic AI
- Mobile App (.ipa for iOS, or .apk or .aab for Android)
- Signing Credentials (see Signing Secure Android apps and Signing Secure iOS apps)
How to Use Mobile Risk Index™
1. Log in to your Appdome account.
2. Click on the arrow icon under “What’s in My Mobile Risk Index?” on the top of the page.
![]()
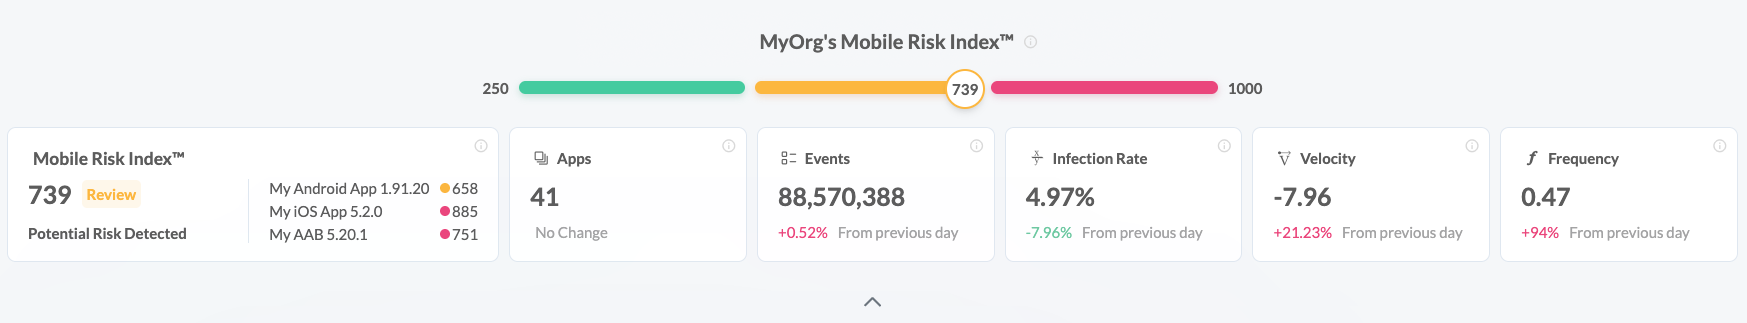
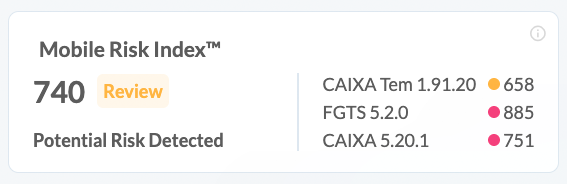
The Risk Index ranges from 250-1000:
250-500 (Normal): No significant risks detected. No immediate action is required.
501-750 (Review): Moderate risks detected. Review and analyze your app’s security.
751-1000 (Act): High risks detected. Immediate action is needed to mitigate threats.
3. Explore The MRI Info Cards and Risk Drivers;
- Mobile Risk Index™ shows the overall MRI score across all impacted apps with over 1,000 installs, with a side panel highlighting the three latest builds by event volume and their individual scores.
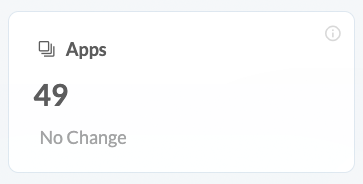
- Apps Card shows how many apps are included in the MRI calculation, The MRI is calculated only for apps with upwards of 1000 installs.
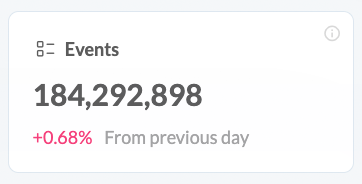
- Events shows the total number of threat events used to compute the MRI across all included apps.
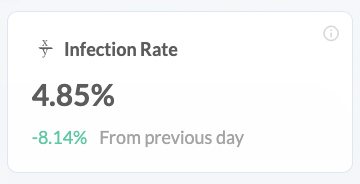
- Infection Rate is the proportion of app installs impacted by threats, showing how broadly a threat has spread across the user base; it’s calculated by dividing the number of infected installs by the total installs.
Example: If 1,000 devices have installed your app and 100 are infected, the infection rate is 10%.
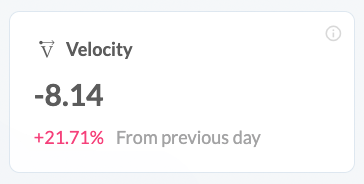
- Velocity measures how quickly the infection rate is changing over time, helping teams spot accelerating threats early; it’s calculated by comparing infection rate values across defined time intervals.
Example: If the infection rate increases from 5% to 10% over a month, velocity indicates an accelerating trend.
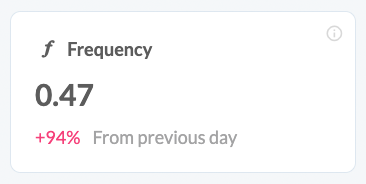
- Frequency represents the number of attack events per user session, indicating how actively threats target users during normal app usage; it’s calculated by dividing total attack events by the number of sessions.
Example: If there are 50 attack events across 25 sessions, the frequency is 2 attacks per session.
Related Articles
- How to use Appdome’s AI Agent Team
- How to Use Appdome’s Support Agent
- How To use No-Code Security for Android & iOS Apps
- How To Get Started with Appdome
- How To Release Secured Android & iOS Apps
- Appdome Support Levels Overview
How Do I Learn More?
If you have any questions, please send them our way at support.appdome.com or via the chat window on the Appdome platform.
Thank you!
Thanks for visiting Appdome! Our mission is to secure every app on the planet by making mobile app security easy. We hope we’re living up to the mission with your project.