
Understanding ThreatScope Mobile XTM
Intro
ThreatScope Mobile XTM offers insight into the actual attacks and threats faced by Appdome-protected apps once they’re released into production. The dashboard’s data refreshes every hour, allowing security teams to monitor evolving attacks and swiftly respond to emerging trends in real-time. To ensure that threats faced by a protected app are displayed on the dashboard, there’s no need for prerequisites, API integrations by the Operations teams, or code changes by the mobile development teams.
Setting up Access to ThreatScope Dashboard
Access to a protected app’s threat data on the ThreatScope Dashboard is gated only to viewer accounts that meet the following conditions:
- The viewer account is licensed to access the ThreatScope Dashboard
Submit a request to Appdome support to activate the license for the accounts that should have access to threat data. - Threat data originates from teams of which the viewer is a member.
The team leader of each production team should configure the viewer account. For details, see the section Configuring the Viewer Account. - The viewer has the View ThreatScope entitlement in the team.
For more details, see the section Add View ThreatScope Entitlement to Members Account below.
Configuring the Viewer Account
To configure the viewer account, the team leader needs to:
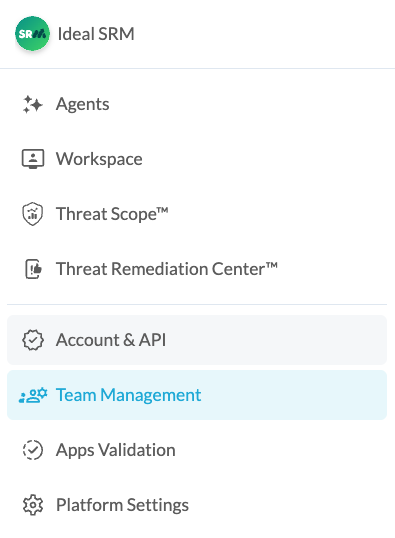
- Open the User Menu.
- Click on Team Management.
- Search for the relevant team.
- Review the team member list.
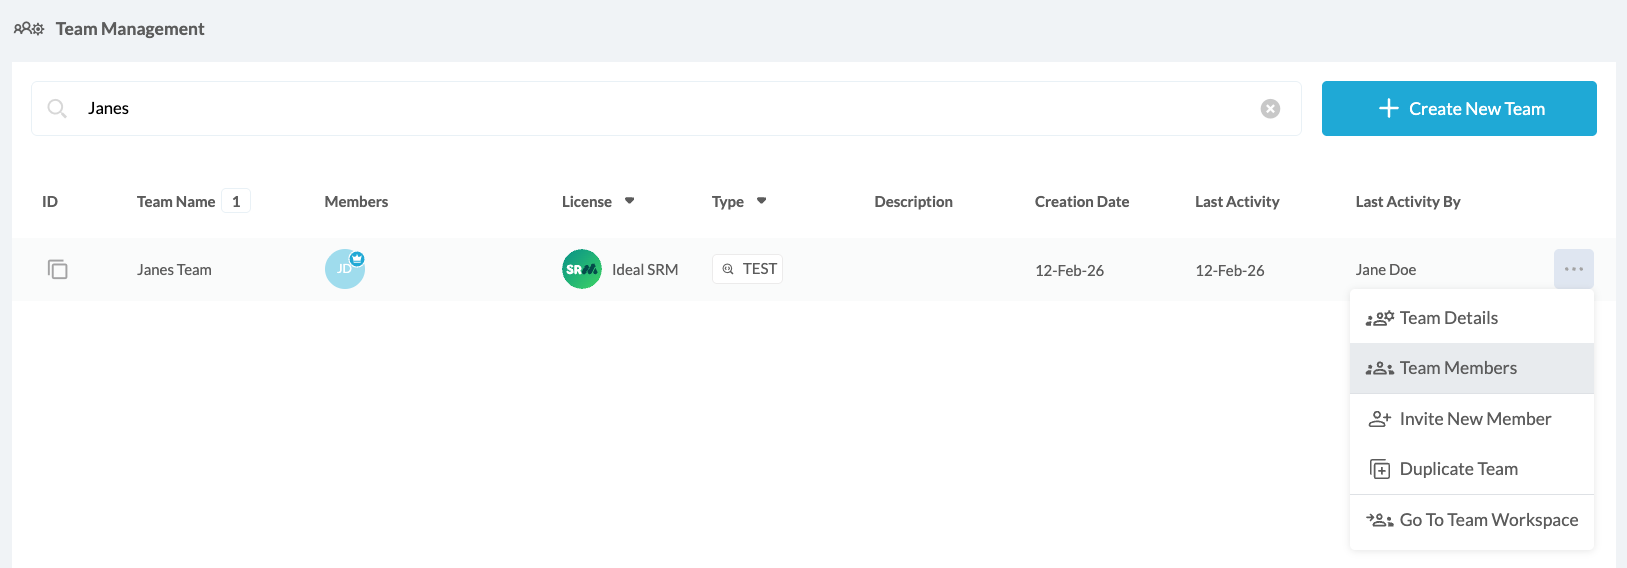
If the requested viewer’s account does not appear, invite the viewer by clicking the Invite New Member button.

- Type the viewer account’s name and hit enter. When done, click Invite.
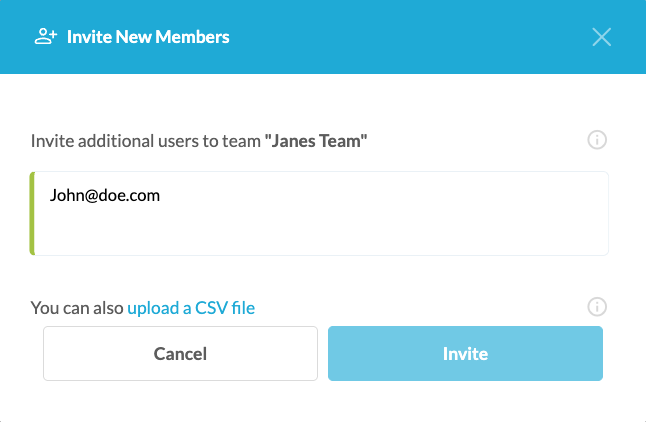
- After the viewer accepts the invitation, proceed to the next step of adding the required entitlements to the team.
Add View ThreatScope Entitlement to Members Account
In order to add the View ThreatScope entitlement to a member’s account of a production team, the team leader should follow these steps:
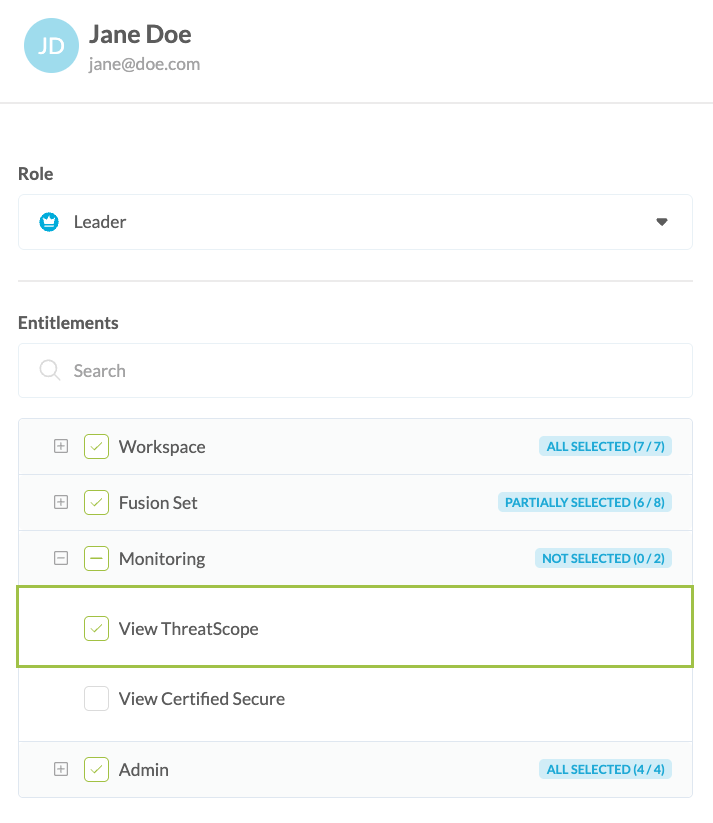
- Click on Team Management account in the user menu and click the button to add entitlements.
A list of the entitlements available for the account will be displayed. - Click the View ThreatScope entitlement.
Reviewing the Dashboard Structure
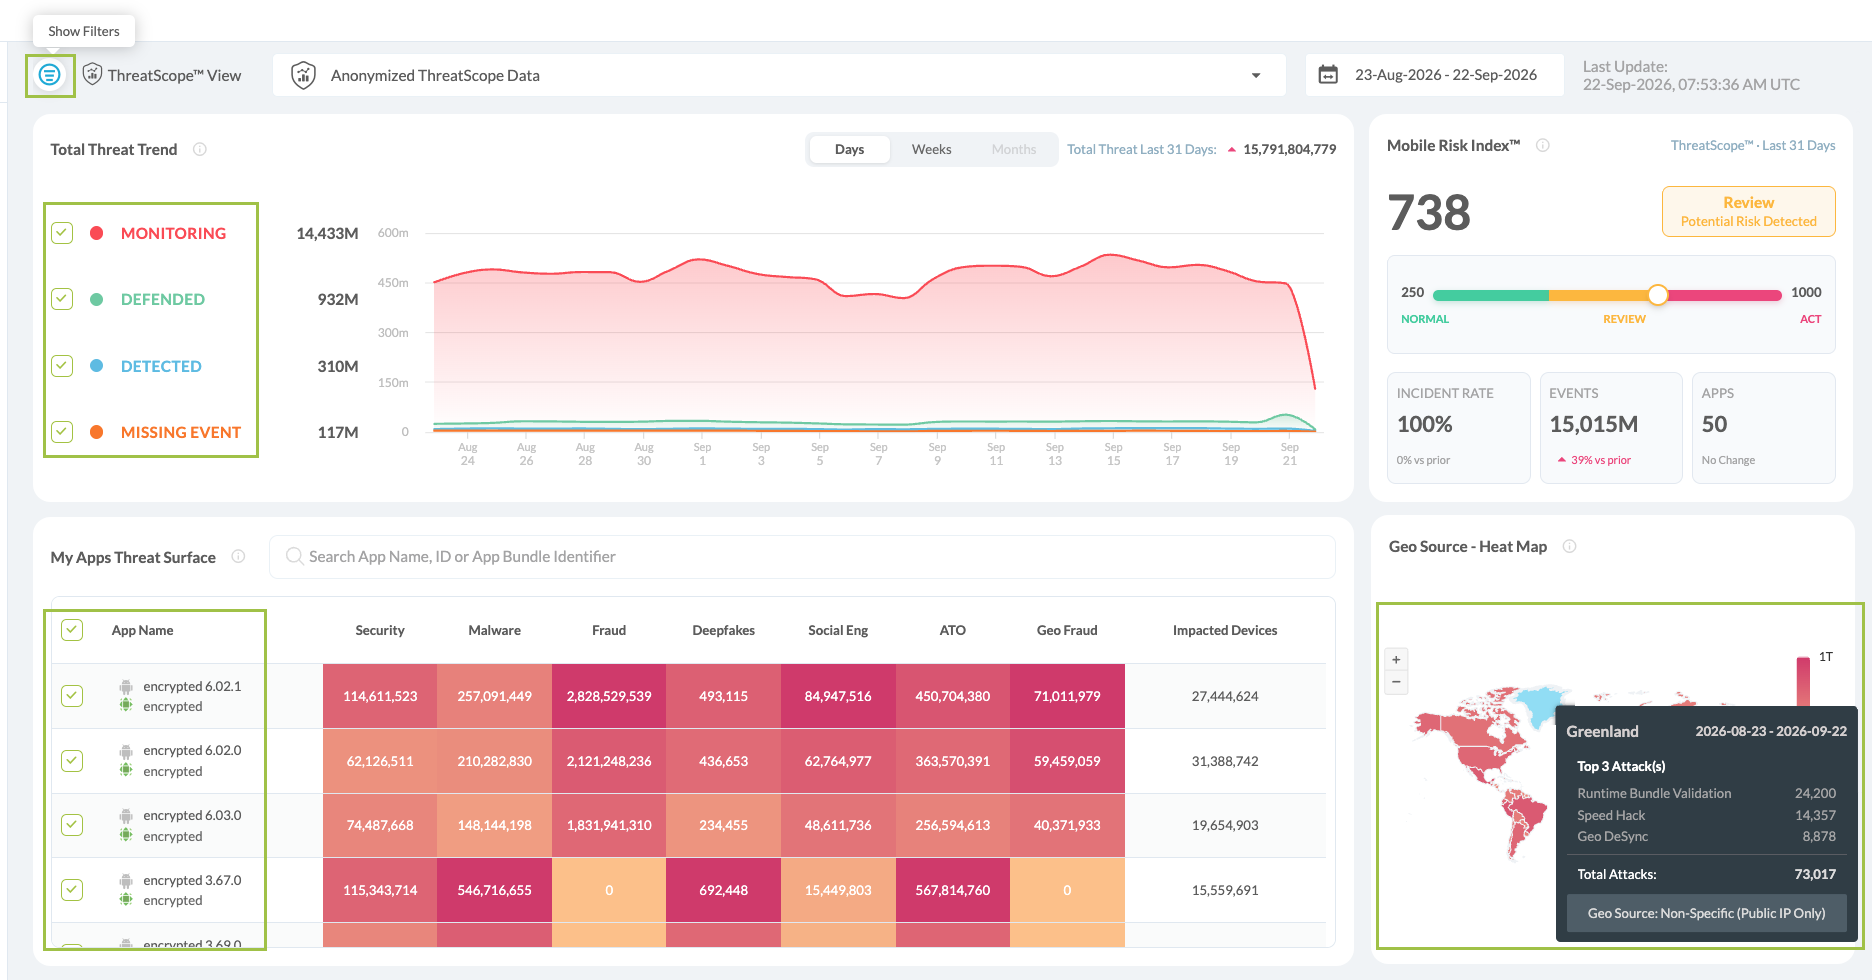
The dashboard allows you to perform the following tasks:
- Select the viewing scope
- Select the date range
- Review the Total Threat Trend
- Review the Mobile Risk Index™
- Review the My Apps Threat Surface
- Review the geographical source of threats
- Review top incidents by device and operating system
- View the Attack Breakdown
Selecting the Viewing Scope
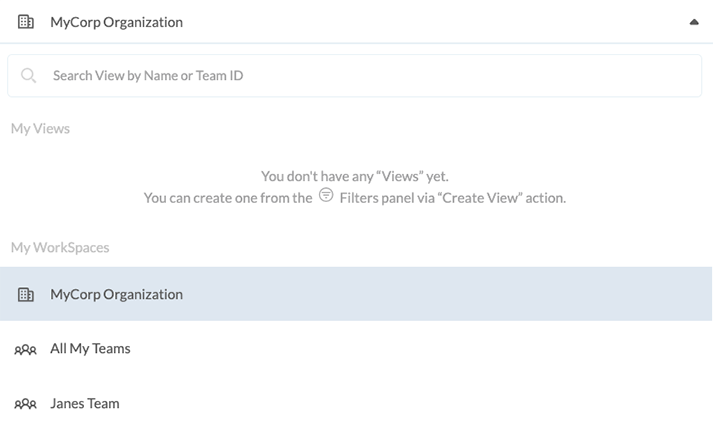
The dashboard viewer allows defining the scope of data items (threats) to be displayed from the following options:
- A specific team
View only threats associated with apps built by the selected team - A specific organization
When the user is a part of a Company and has ThreatScope entitlements - Personal workspace
The data for the apps that are uploaded and managed within the user’s personal workspace - All my teams
View threats associated with apps built by all teams that the ThreatScope viewer is entitled to access
Selecting the Date Range
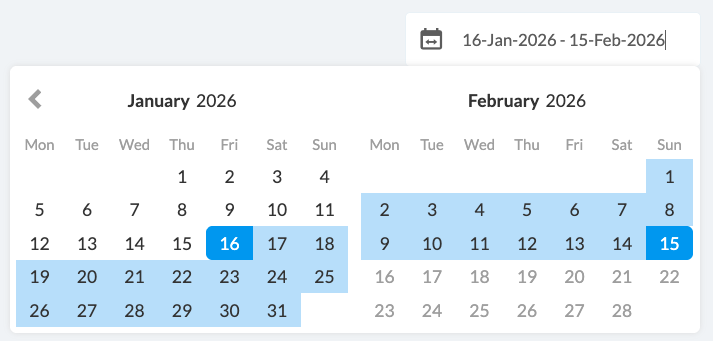
The Set Date Range section defines the date range of data items (threats) to be displayed. By default, the date range is set to the last 30 days, but this range can be extended.
Total Threat Trend
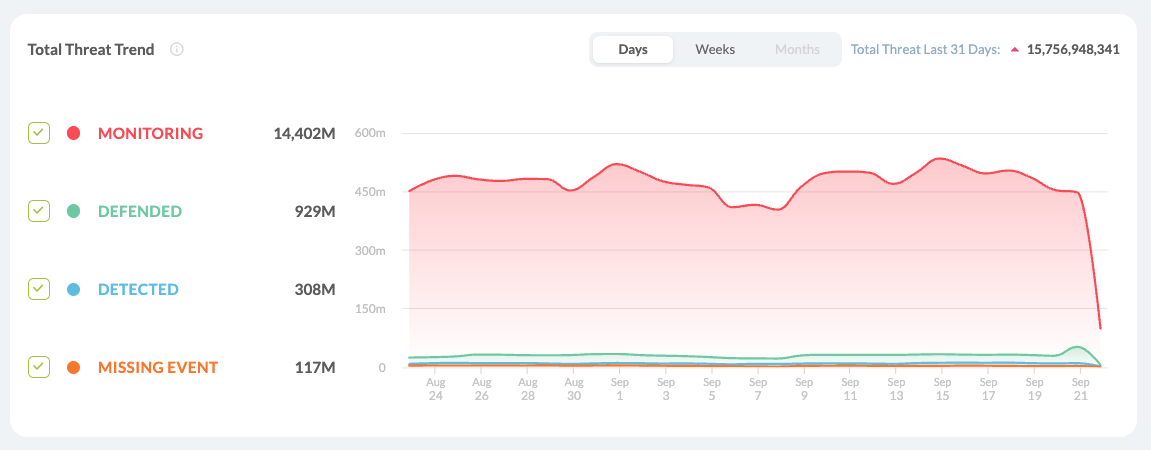
The Total Threat Trend widget provides an overview of threat activity over the selected timeframe. It displays the total number of threats and visualizes changes in threat activity over time.
Threat activity is organized by implementation stream:
- Monitoring – Threats monitored without in-app detection or defense.
- Defended – Threats for which In-App Defense is enabled.
- Detected – Threats for which In-App Detection is enabled.
- Missing Event – Threats for which Threat-Events™ is not enabled.
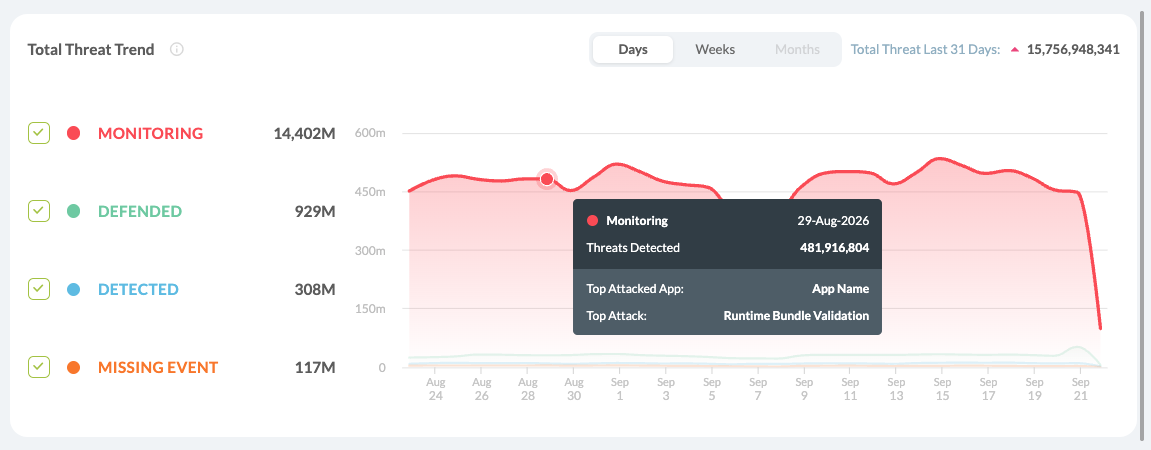
Select or clear an implementation stream to control which threat data is displayed in the trend graph. Use the Days, Weeks, and Months options to change how threat activity is displayed over the selected timeframe. Hover over any point on the trend graph to view additional details for a specific point in time, including the number of threats detected, the top attacked app, and the top attack for the selected implementation stream.
Hover over any point on the trend graph to view additional details for a specific point in time, including the number of threats detected, the top attacked app, and the top attack for the selected implementation stream.
Mobile Risk Overview
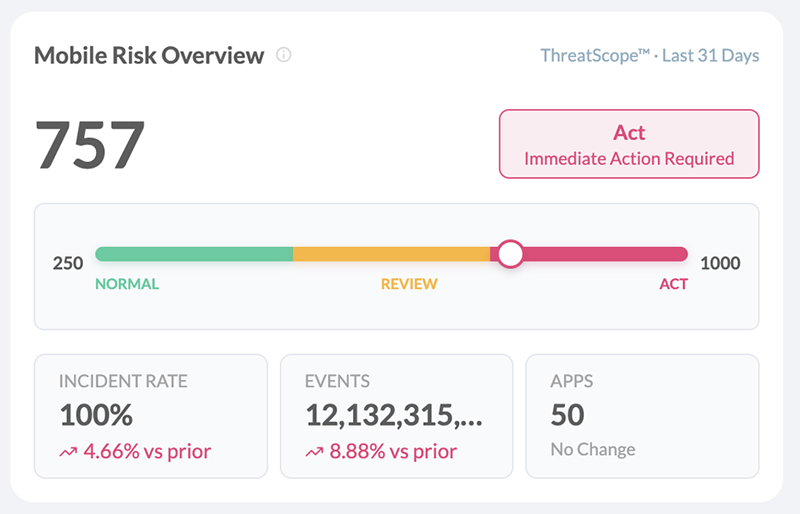
The Mobile Risk Overview provides a high-level view of the organization’s mobile risk over the selected timeframe. The widget displays the current risk score and indicates whether the overall risk level is Normal, Review, or Act, helping users quickly identify when attention or immediate action may be required.
The widget also summarizes the Incident Rate, total number of Events, and number of Apps, including changes compared to the prior period.
My Apps Threat Surface
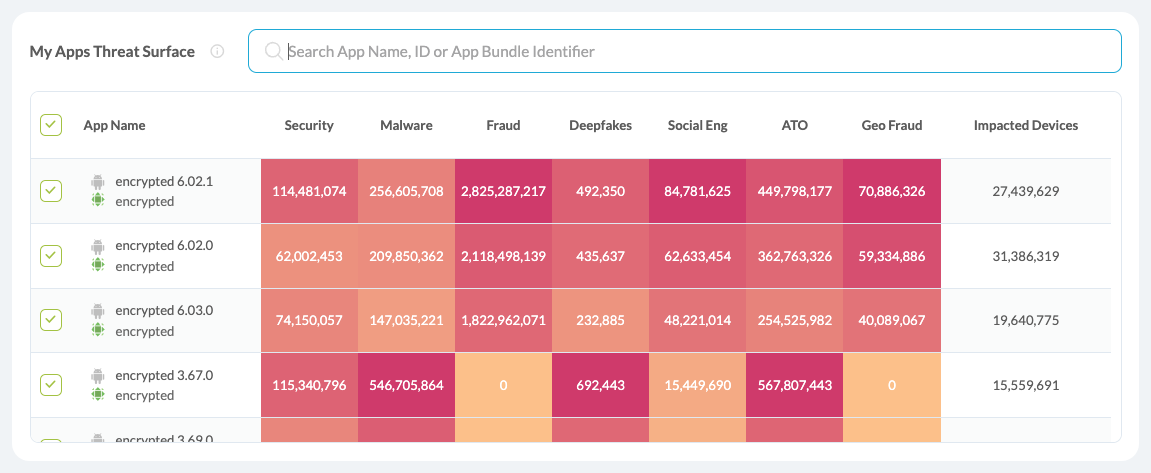
The My Apps Threat Surface provides an app-level view of threat activity across your protected apps. Use the search field to locate a specific app by App Name, ID, or App Bundle Identifier.
For each app, the widget displays threat activity across the following categories:
- Security
- Malware
- Fraud
- ATO
- Social Engineering
- Cheat
- Geo Fraud
The Impacted Devices column shows the number of devices affected by detected threats for each app. Select one or more apps to focus the ThreatScope dashboard on the selected applications.
Geo Source Heat Map
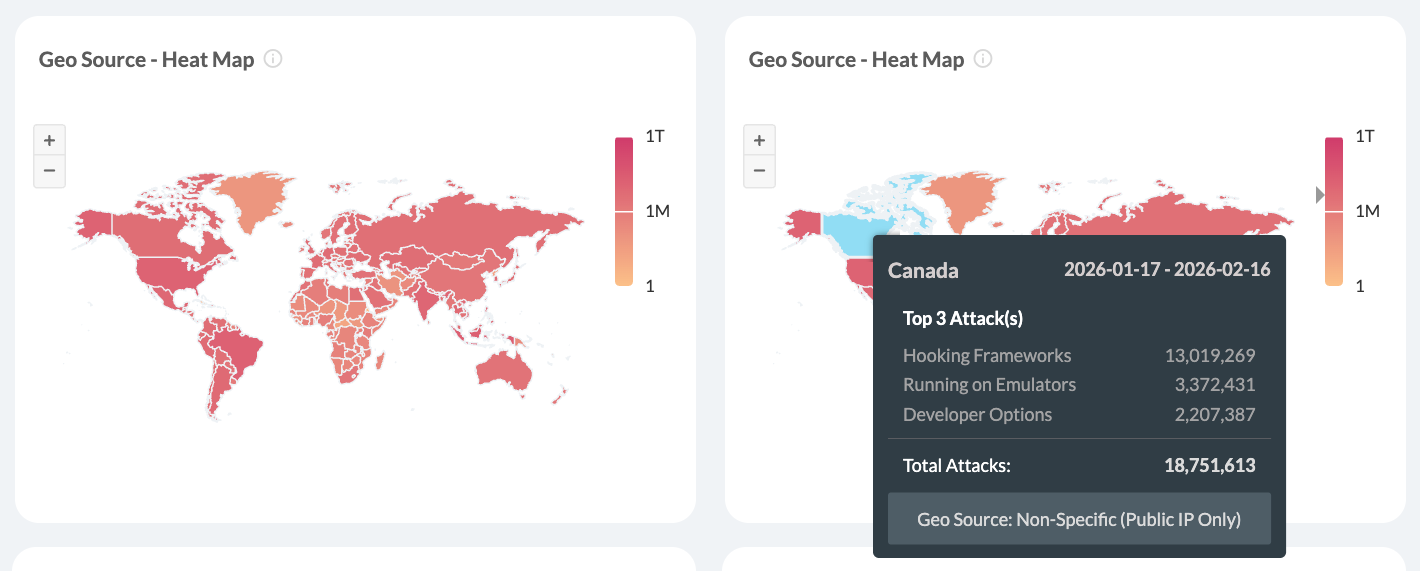
The GeoSource section displays a map that allows viewing the country from which the attacks originate.
Countries are colored based on the volume of threats detected in the region. For clarification, see the legend on the right.
Hover over the requested country to see a breakdown of the information by the following items:
- Country name
- Date Range
Only threats from the listed date range are aggregated. - Total attacks
The sum represents all attacks originating from the country over which the mouse hovers. - Top 3 Attacks
The top attacks for the selected country
To select one or more countries:
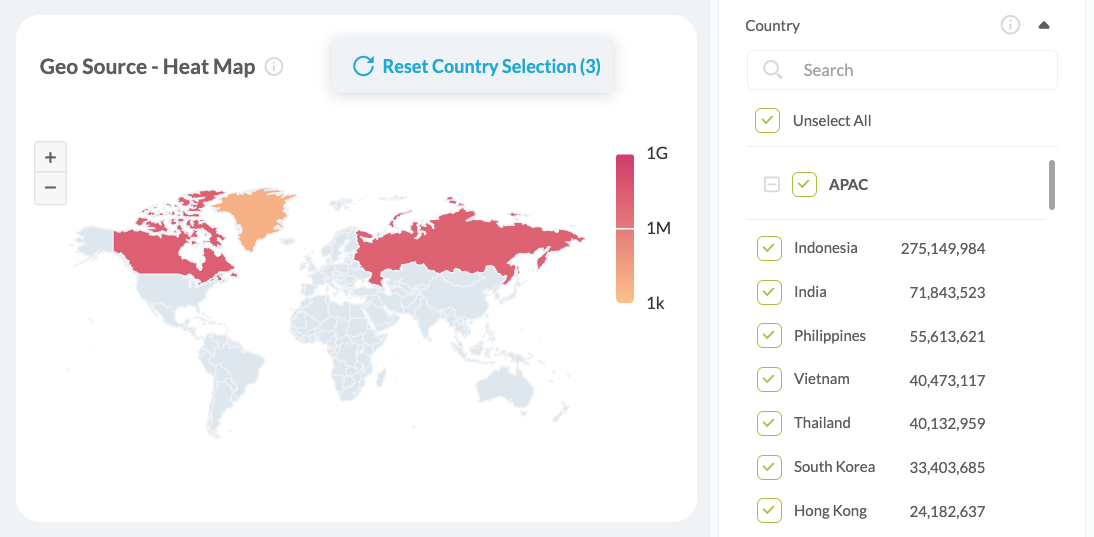
- To select a single country, click the requested country on the map or choose its corresponding checkbox on the left side filter menu.
To deselect a country, click the checkbox of the already selected country. - To select multiple countries, check the boxes next to each requested country or select them by clicking on them directly on the map display.
- To reset selection click Reset Country Selection on the top right side of the map display.
- All other ThreatScope displays will update according to the selected countries.
Types of Geography-based data input
The following types of geography-based data input exist:
- Non-specific
The default data input on Appdome relies on the public IP address captured from its analytics server to map the threat’s location. Given that attackers can mask their public IP using tools such as VPNs and proxies, this data is labeled as “non-specific,” namely because we cannot always pinpoint the precise source of an attack.
- Specific
In this case, the data input is the device’s location data (GPS). However, since accessing location data requires declaring specific permission in the app and user consent, this type of threat geo-source is not the default option and requires opting in when building the app on Appdome.
The app’s developer is responsible for adding the required location permissions and requesting user consent to access the device’s location since Appdome will not add location permissions to the protected app and trigger any access to location data without checking if the user has granted access to their location data.
What can be inferred from the data
- Ability to create a focus list of countries that generate the most attacks
Customers that have a web application firewall (WAF) in place can use this data stream to apply different security policies based on the threat landscape of the app and the app’s user base. - Visibility of how the threat types are distributed within a given country
This can enable tracking which vectors are used by different local and global actors.
Top Incidents Breakdown
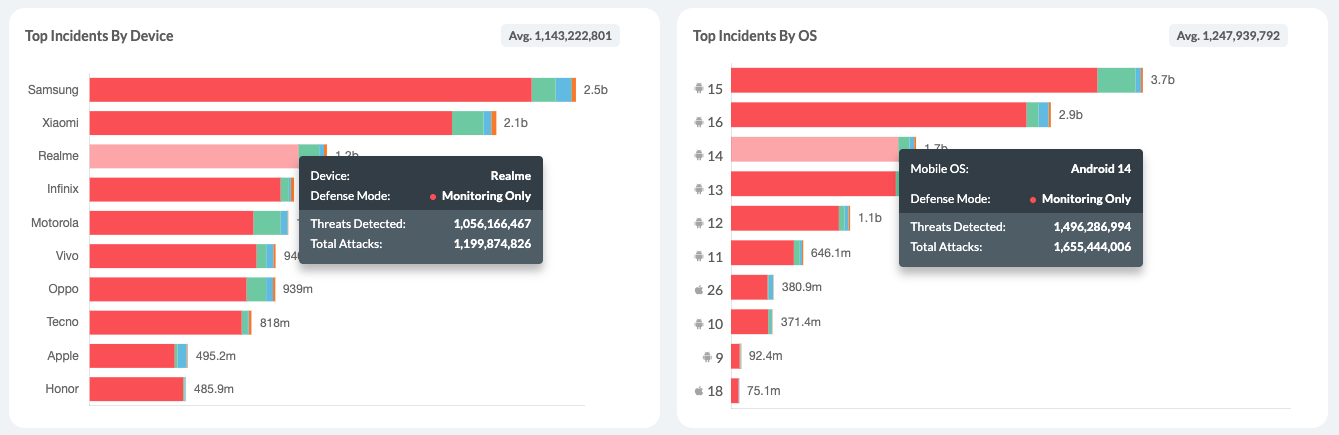
The Top Incidents section displays a breakdown of the top incidents by device manufacturer and operating system.
What can be inferred from the data?
The data displayed in this section helps identify the applications, devices, and operating systems most frequently targeted by attacks.
Hover over a graph bar in any of the Top Incidents by Device or Top Incidents by OS tiles to display the following information:
- Device / Mobile OS
The selected device manufacturer or mobile OS version. - Defense Mode
Appdome Defended / In-App Detection / In-App Defense / Missing Threat Event™ / Monitoring Only. - Threats Detected
The number of threats detected for the selected device or mobile OS under the selected Defense Mode. - Total Attacks
The total number of attacks targeting the selected device or mobile OS.
Attack Breakdown
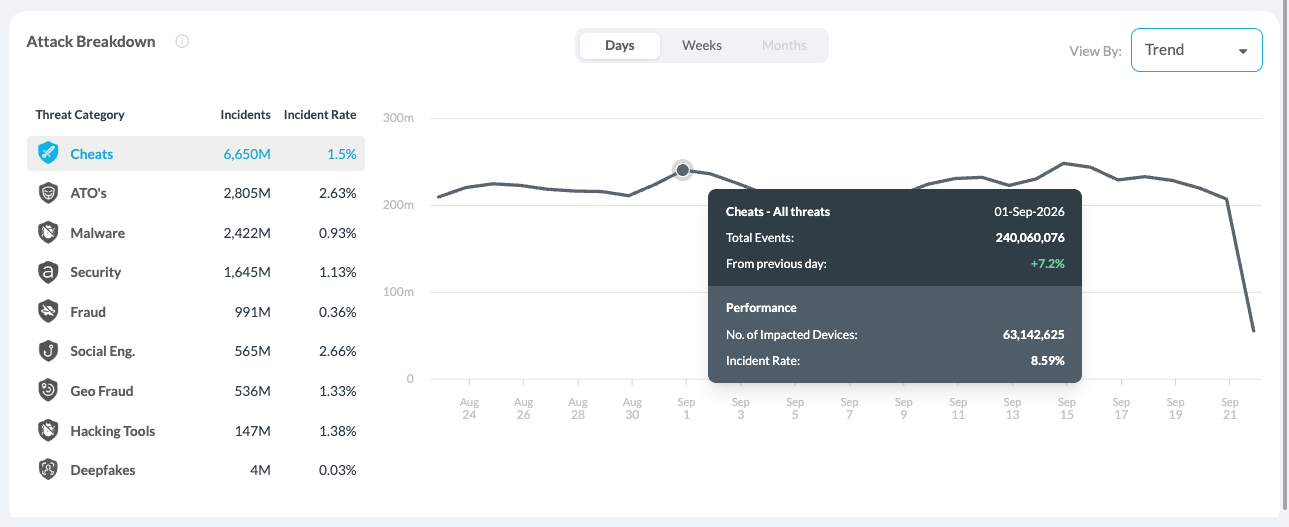
The Attack Breakdown provides a detailed view of threat activity by threat category. For each category, the widget displays the total number of Incidents and the Incident Rate.
Select a threat category to view the attacks associated with that category. Use the View By menu to switch between Count and Trend views.
Count View
The Count view displays the attacks associated with the selected threat category and the number of incidents for each attack.
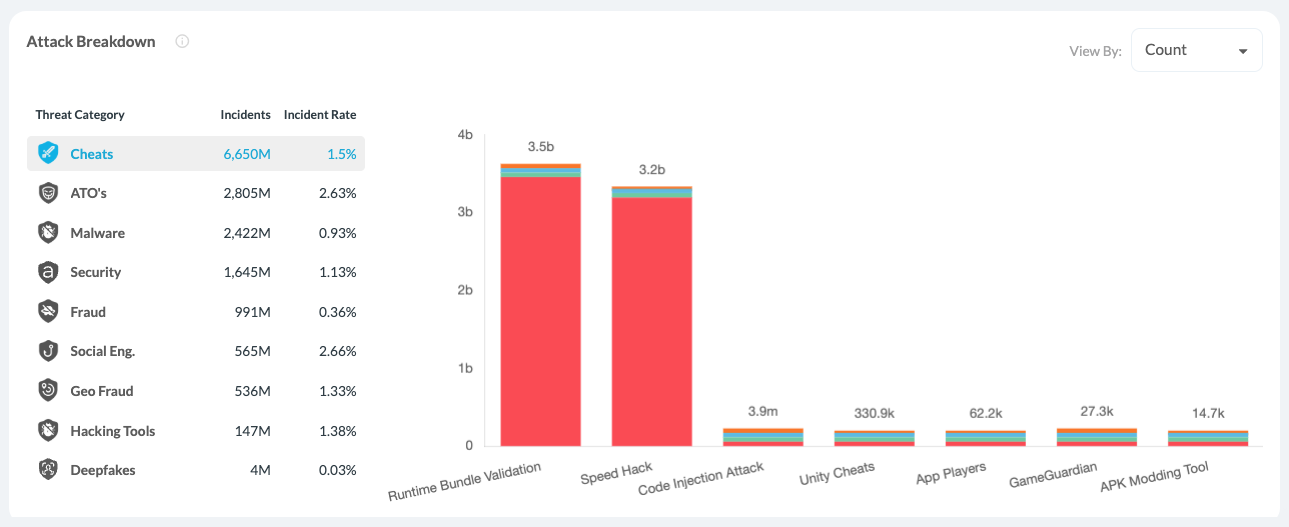
Hover over a graph bar to view additional information about the attack, including:
- Detection Type – The name of the detected threat.
- Defense Mode – The defense implementation associated with the detection.
- Threats Detected – The number of threats detected for the selected defense mode.
- Total Incidents – The total number of incidents for the selected attack.
- Threat-Event™ – Indicates whether Threat-Events™ is enabled for the detection.
- Description – A description of the detected threat.
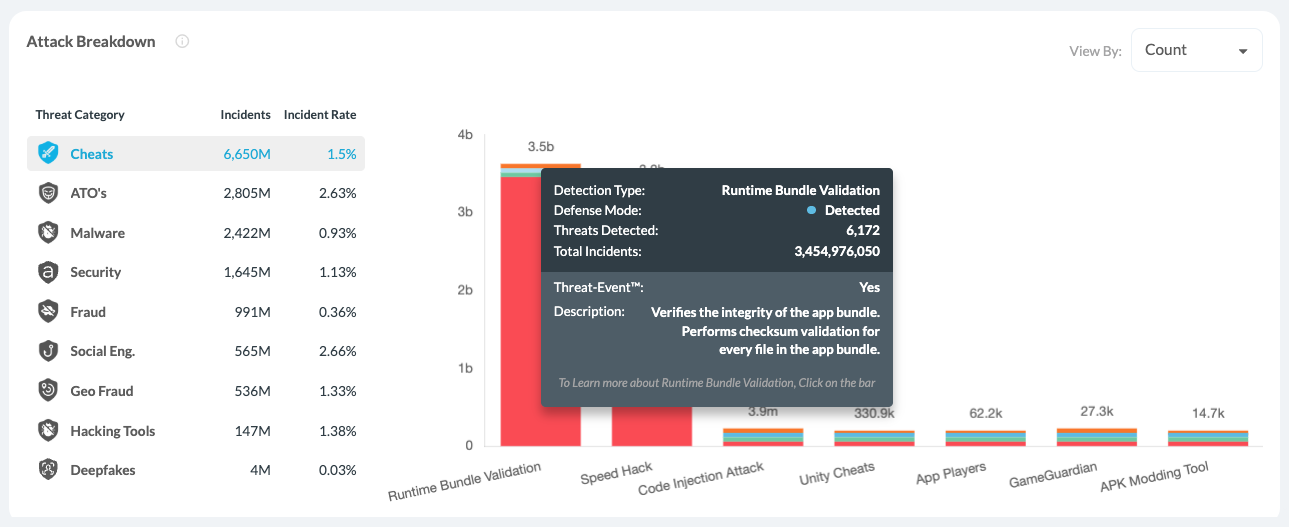
Click a graph bar to learn more about the selected detection.
Trend View
The Trend view displays changes in threat activity for the selected threat category over the chosen timeframe. Use Days, Weeks, or Months to change how the trend is displayed.
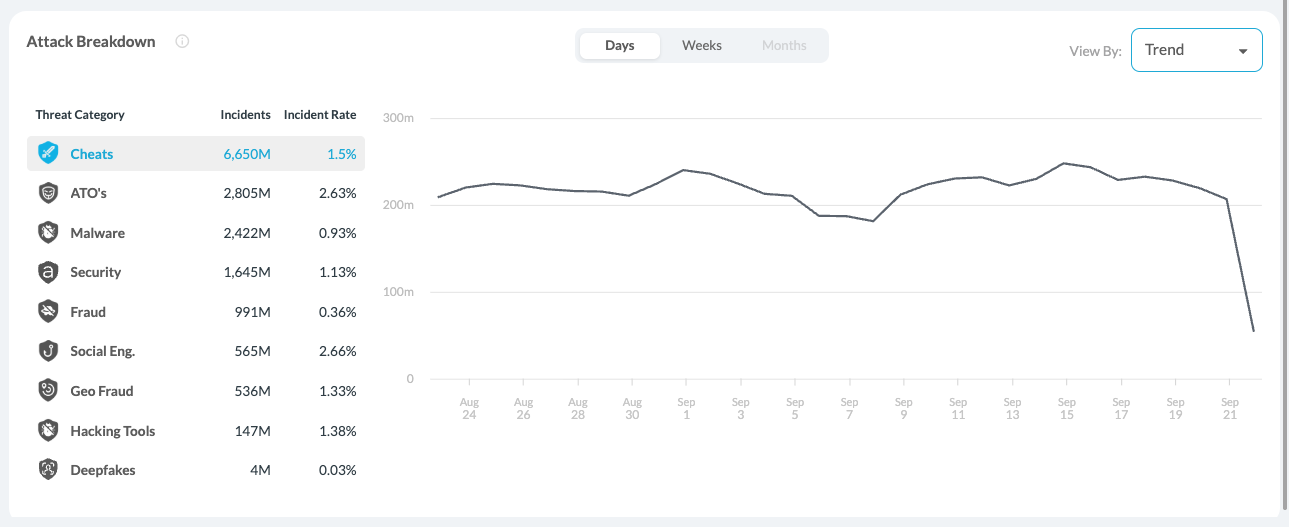
Hover over a point in the graph to view:
- Total Events – The total number of threat events for the selected period.
- From previous day – The percentage change compared to the previous day.
- Number of Impacted Devices – The number of devices impacted during the selected period.
- Incident Rate – The incident rate for the selected period.
Device Detail
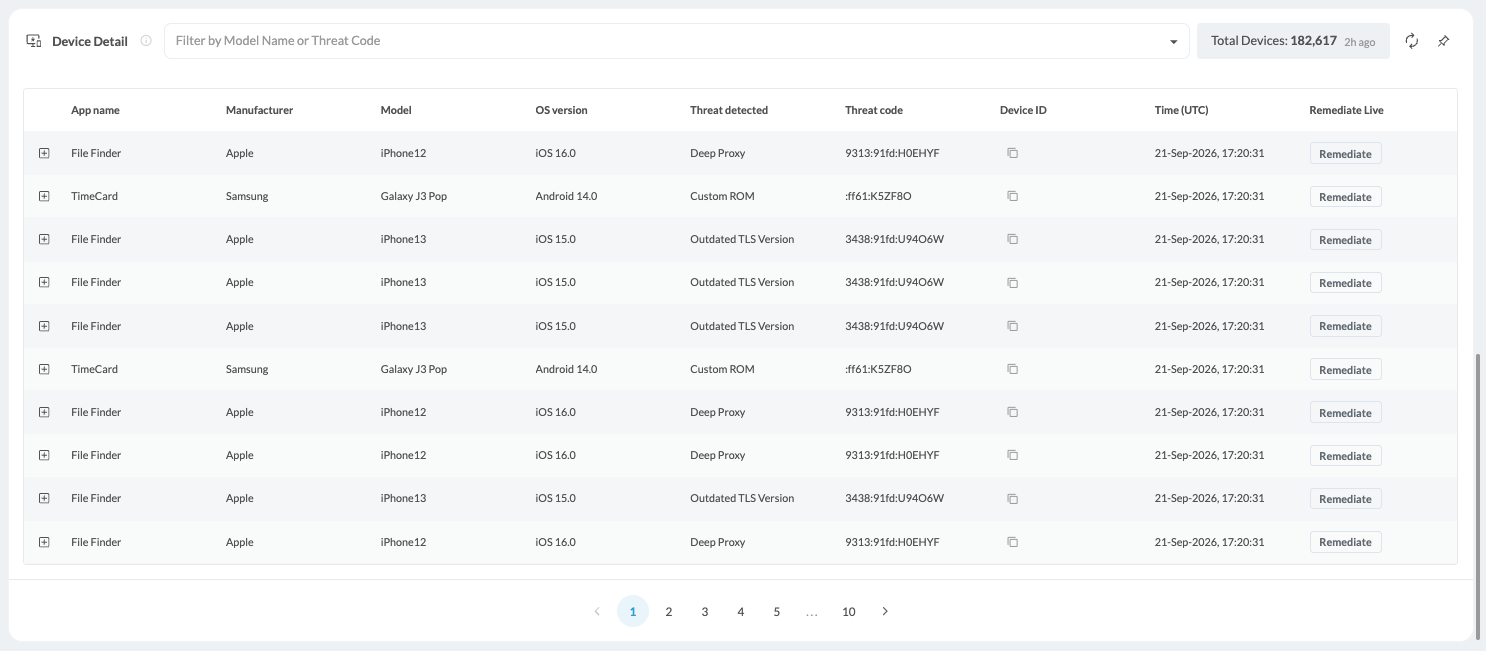
The Device Detail table provides a device-level view of security events detected in protected mobile applications. Each row represents a threat event detected on a device within the selected time range, enabling security and DevSecOps teams to identify affected devices and investigate incidents. Expanding a row reveals additional device, application, and threat information to help teams understand what happened, when it occurred, and which application was affected.
Using this view, teams can:
- Identify devices impacted by security threats
- View when the threat event occurred
- Review the associated Threat Code
- Inspect device details such as manufacturer, model, and OS version
- View and copy the Device ID
- Track multiple threat events affecting the same device
- Use Remediate Live to investigate and respond to detected threats
Users can also filter the table by Model Name or Threat Code.
Key Data Points and Actions
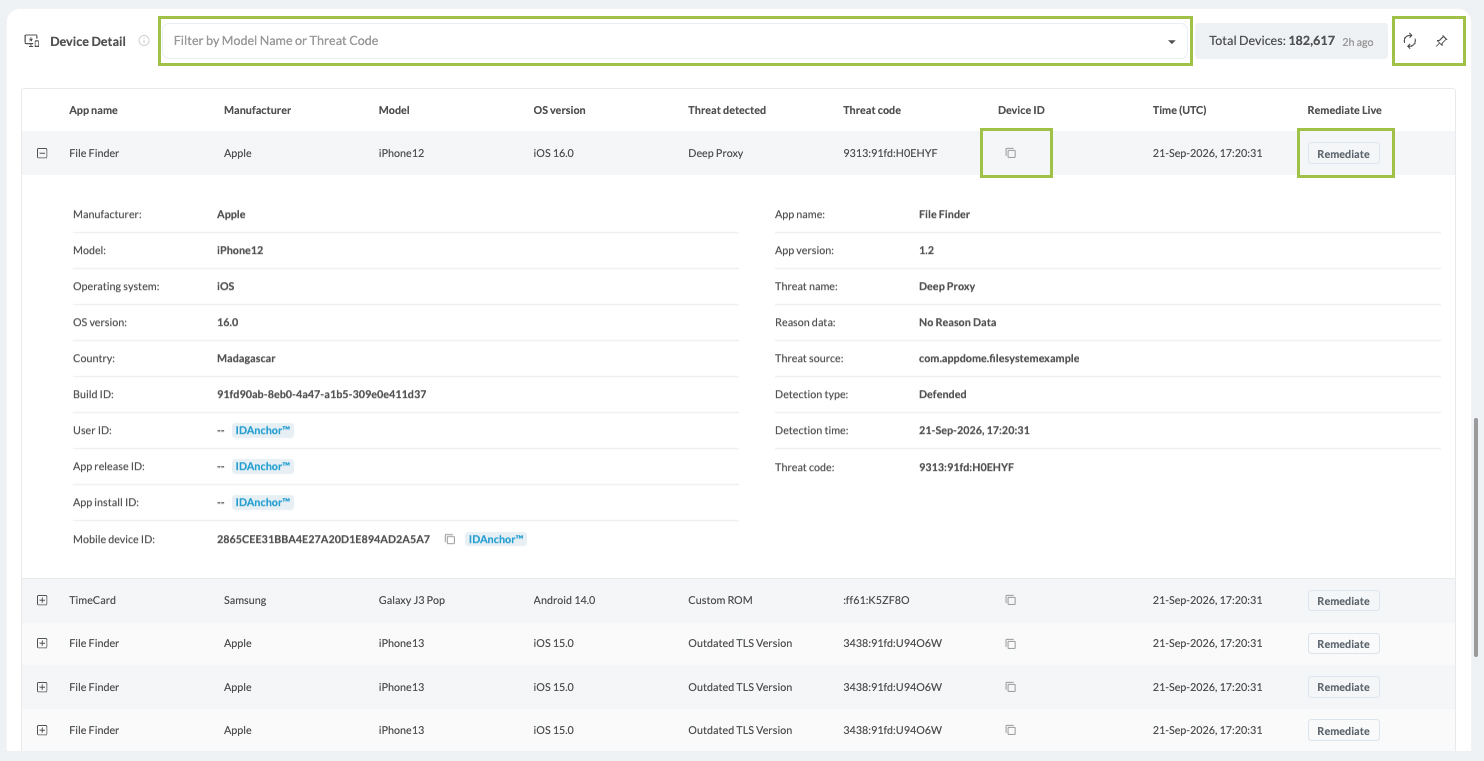
The Device Detail table includes key device, application, and threat information to support investigation. Expand a row to view additional details, including device and OS information, app name and version, detection details, Threat Code, and available IDAnchor™ identifiers.
You can also use the following options:
- Search – Filter the Device Detail table by Model Name or Threat Code.
- Copy Device ID – Copy the Device ID associated with a detection for use in further investigation.
- Remediate – Click Remediate to open the Support Agent and investigate the detected threat.
- Refresh Display – Refresh the Device Detail table to display the latest available data.
- Pin to Top – Keep the Device Detail section pinned to the top of the ThreatScope display.
Integration with the Support Agent
The Device Detail table integrates directly with the Support Agent to help users investigate and respond to detected threats.
Click Remediate for a detected threat to open the Support Agent with the relevant threat context. The Support Agent can provide:
- A detailed explanation of the threat
- Recommended remediation steps
- Additional context about how the attack works
This integration helps teams move from detection → investigation → remediation without manually transferring threat information between ThreatScope and the Support Agent.
Using the SOC Agent
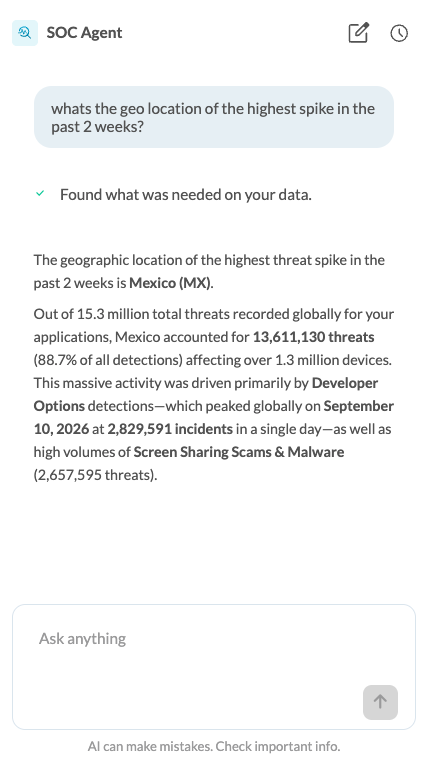
The SOC Agent provides an interactive way to analyze and investigate threat activity in ThreatScope. It analyzes mobile threat data and correlates detected attacks with the app’s defense posture to surface trends, severity, impact, and risk.
Use the SOC Agent’s natural-language interface to ask questions about your threat data, such as where threat activity is occurring, which attacks are increasing, or which apps and devices are most affected. The SOC Agent analyzes the available data and provides relevant findings and context to help security, fraud, and risk teams investigate threats and determine next steps.
Filtering the Display
ThreatScope provides multiple ways to filter the data displayed across the dashboard. You can apply filters using the main filtering menu or directly from supported dashboard widgets.
You can filter the ThreatScope display in the following ways:
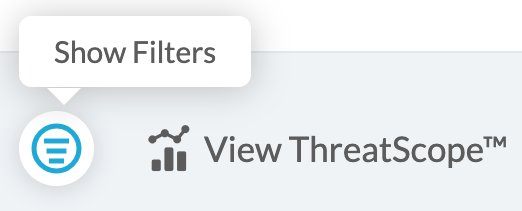
- Main filtering menu – Click the Show Filters icon in the upper-left corner to access the available filtering options, refer to the dedicated filtering section of this article.
- Total Threat Trend – Select or clear Monitoring, Defended, Detected, or Missing Event to filter by implementation stream.
- My Apps Threat Surface – Select one or more apps using the checkboxes next to the app names to filter the dashboard by application.
- Geo Source – Heat Map – Select a country on the map to filter threat data by geographic source.
Applied filters update the ThreatScope dashboard to focus the displayed threat data on the selected criteria.
Filtering Threat Intelligence
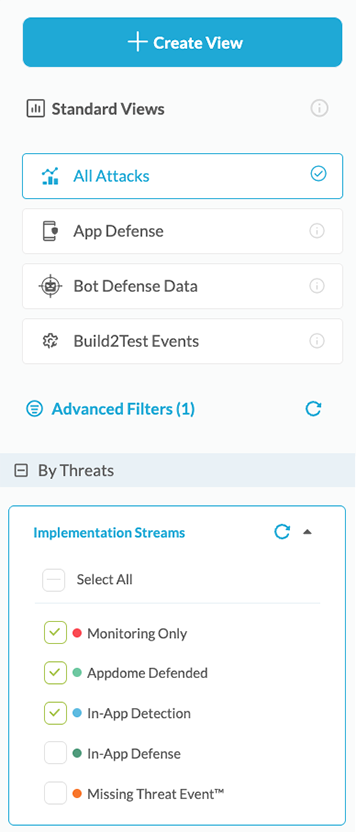
Standard Views
Click on the Show Filters on icon on the top left corner to open it from the left side panel.
The Standard Views menu on the left side panel enables easy filtering and creation of custom views for the Threat Scope data.
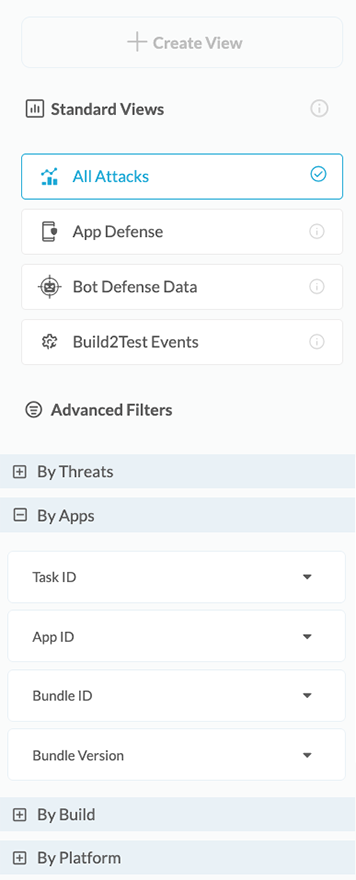
1. Select the Data displayed from one of the following categories

All Attacks – Displays all accumulated data by the number of individual events. If a specific device experiences several events of the same type, all events will be counted.

App Defense –Displays all Appdome detections whether or not they are enforced on the client app or sent to the client app via Threat Events.

Bot Defense Data—Access complete payload data from Appdome’s MobileBOT™ Defense (MBD) solution for insights on mobile infrastructure. Correlating and validating real attacks can detect and prevent attacks like credential stuffing and DDoS.

Build2Test Events—This function summarizes the Threat Events data only for apps built with the Build-to-Test feature. These apps are built specifically for testing via third-party vendors.
Learn more about Appdome’s Build-to-Test
2. Filter the data
You can filter the data using any of the following filters and combine them to create unique views, gaining deeper insights into the events your Appdome-built apps are facing.
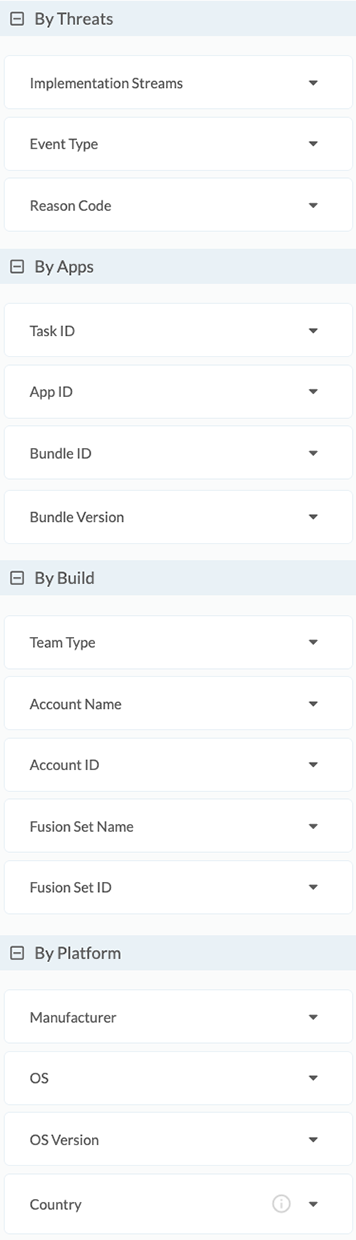
The filters that can be used for controlling the displayed data are:
- By Threats
- Performance By – The type of defense implemented in Threat Events.
- Event Type – The Type of Event that was triggered (By Appdome’s defense categories)
- By Apps
- Task ID – The unique ID of the task (upload/build/context/sign)
- App ID – The unique ID of the app.
- Bundle ID – The app’s identifier is listed in the AndroidManifest.xml or Info.plist file.
- Bundle Version – The app’s version number.
- By Build
- Team Type – The type of the team that ran the app builds.
- Account Name – The name of the account plus the team type.
- Account ID – The ID of the account.
- Fusion Set Name – The name of the fusion set to which the protected app is subscribed.
- Fusion Set ID – The ID of the fusion set to which the protected app is subscribed.
- By Platform
- Manufacturer – The device manufacturer associated with the detected attack.
- OS – The platform related to the detected attack.
- OS Version – The OS Version associated with the detected attack
- Country – A specific Geo Source.
3. Create View
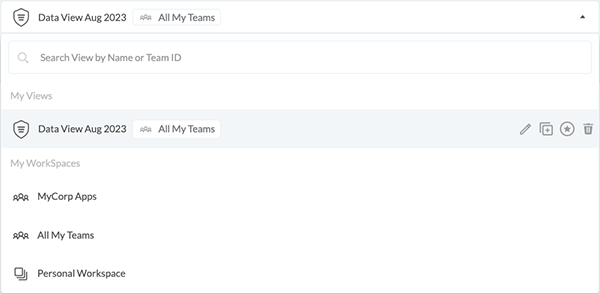
When the data is filtered, you can save it by creating a view.
You can access your custom views via the main drop-down menu.
Learn more about Standard Views and creating custom Threat Views with ThreatScope.
Troubleshooting Access to ThreatScope Dashboard
This section provides troubleshooting information for resolving the following issues:
- Lack of the View ThreatScope entitlement.
- The viewer is a member of a team but does not have the View ThreatScope entitlement.
- The viewer is not a member of any team.
- The viewer or View ThreatScope entitlement was removed.
- If the viewer was a member of a team or had view entitlements, then the viewer was removed from the team or the view entitlement was removed.
Lack of the View ThreatScope entitlement
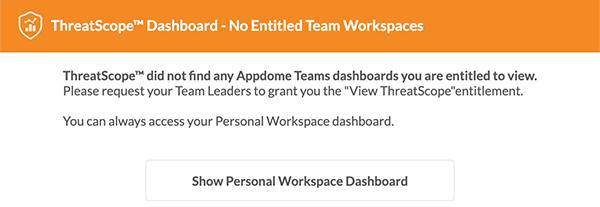
Cause:
The viewer attempted to access the ThreatScope dashboard, but while the viewer’s account is a member of at least one team, that team does not have View ThreatScope entitlement permissions.
Remediation:
Add the View ThreatScope entitlement to each team to give the viewer access to threat data. For additional information, see the section on Setting up access to ThreatScope Dashboard.
Viewer is not a member of any team
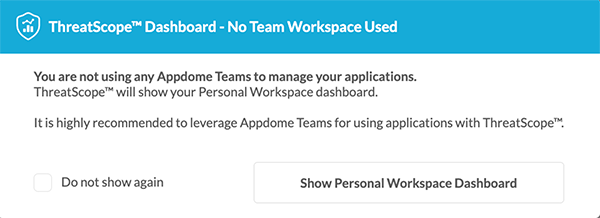
Cause:
The viewer tried to access the ThreatScope dashboard by using the All My Teams workspace, but the viewer’s account is not a member of any team.
Remediation:
Request the production team leader to invite the viewer’s account to join the team and add the View ThreatScope entitlement to each team so that the viewer can access the threat data. For further information, see the section Setting up access to the ThreatScope Dashboard.
A viewer or View ThreatScope entitlement was removed
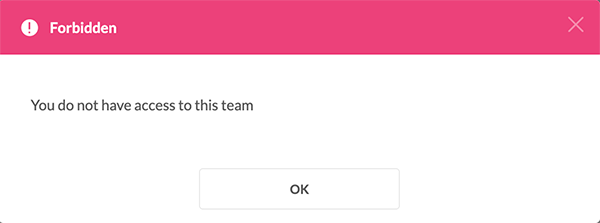
Cause:
The viewer tried to access a team in the ThreatScope dashboard; however, the viewer’s account was removed from that team, or the View ThreatScope entitlement was removed from the viewer’s account in that team.
Remediation:
Request the production team leader to invite the viewer’s account to join the team and add the View ThreatScope entitlement to each team so that the viewer can access the threat data. For further information, see the section Setting up access to ThreatScope Dashboard.
Related Articles
- How to use ThreatScope™ – Threat Dynamics
- Threat-Events™, In-App Threat Intelligence in Native iOS Apps
- How to Use ThreatScope™ User Remediation Center
- Understanding ThreatScope Views
How Do I Learn More?
If you have any questions, please send them our way at support.appdome.com or via the chat window on the Appdome platform.
Thank you!
Thanks for visiting Appdome! Our mission is to secure every app on the planet by making mobile app security easy. We hope we’re living up to the mission with your project.